1 a.m. Breakout Bars
Swing Reversals in the most recent environment - Part 1
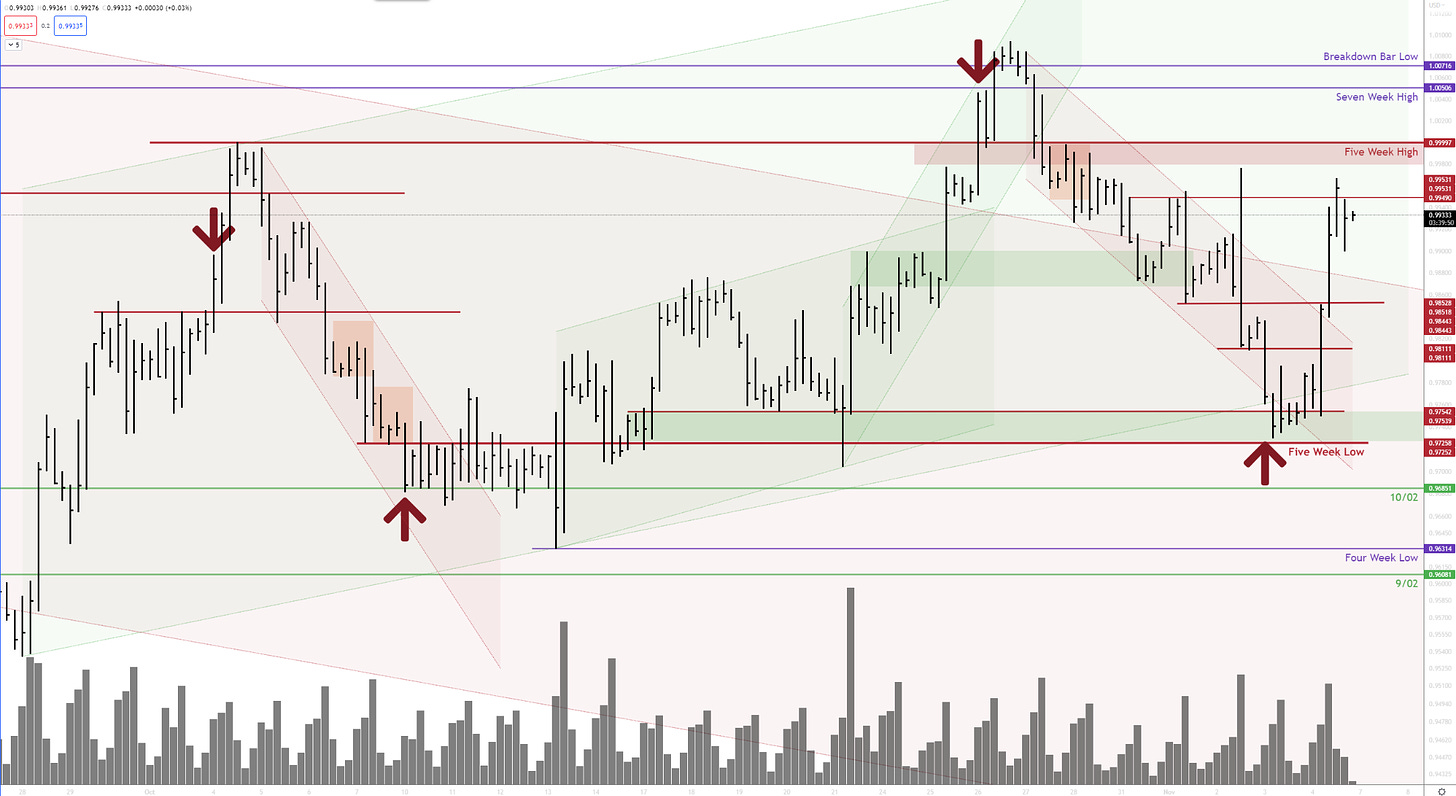
The last four swing reversals were “announced” by 1 a.m. breakout bars. Each breakout bar is marked with a purple arrow. This behavior is not always associated with swing reversals. There are a number of examples in the not so distant past where 1 a.m. breakout bars produced high quality continuation. I think the lesson here is to be aware of them in order to be prepared for what may come. In other words, the 1 a.m. breakout bar can be factored into scenarios analysis / planning.
Is it the fact that the breaks occur during the 1 a.m. bar? Or is it that the volume is moderate or low? The volume is an important factor, especially when the market is breaking free of a range of longer duration. The increased volume over the local average indicates a commitment for continuation from the buyers or sellers. Low volume breaks don’t show a definitive commitment.
However, for example, if buyers are in control and prices are generally pushing higher, it’s not always necessary for the market to show a strong commitment from buyers because buyers are already in control. The sellers will need to prove themselves in this case. Therefore, the market may proceed upward on lower volume - ease of movement because there is no selling friction in the market. But, when the market is moving with ease, it will be susceptible to the emergence of supply, whenever it may appear.
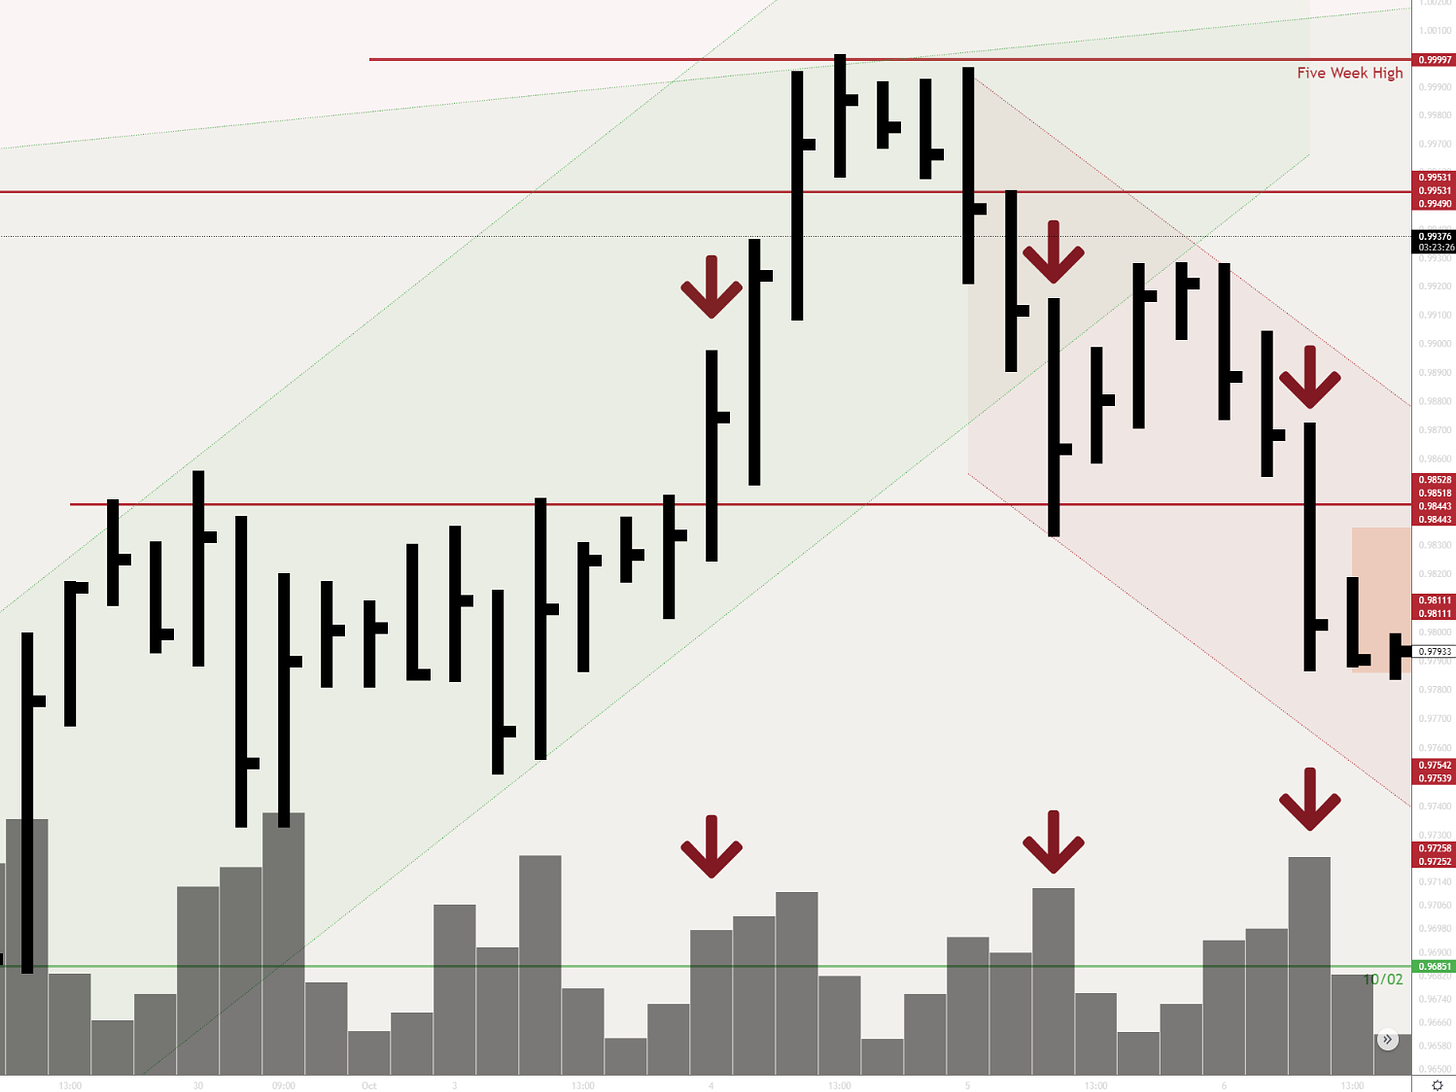
Let’s look at the area of the first swing reversal. The 1 a.m. breakout bar is not impressive in terms of spread or volume. The spread is average for the area - with a number of other bars being stronger in terms of both spread and volume. Buyers won the bar and it is a breakout. The bar does suggest the potential for upside continuation, which does come with increasing spread and volume (although the volume is still lower than the higher volume bars of the preceding four days. The average volumes are decreasing, which shows a decreasing amount of participation in the up trend. In other words, the bigger players have “left it to retail.” The market is now susceptible to reversal.
The market is unable to test the supply line of the bull channel, a subtle tell of weakness as it shows a loss of momentum and a deterioration of buying pressure. AND, it occurs after an invalid break. We have to start putting the storyline together. It’s not yet a complete story, but it is an additional detail.
The next day’s 9 a.m. bar breaks the demand line of the bull channel on increasing spread and volume, though not very high volume. It fails to break support and actually shows buying off the low. The market attempts to hold support. We have a few more clues: the market retraces the entire breakout move with expanding spread and volume which demonstrates the presence of supply (not the ideal condition for a successful test of new support); the market breaks the bull channel with increasing spread and volume with the majority of the breakout bar closing below the demand line (once again illustrating the presence of supply, but also showing a change of character in the sense that the market showed no buying from the demand line which had produced buying on all previous touches).
What follows is alarming for bulls. The market is testing new support, the place where the last interaction was a breakout with continuation on gently increasing spread and volume. The last interaction with this level showed the presence of buying which was able to push price higher. The current interaction with support shows a lack of buying. If this is support, if this is a place where demand overwhelmed supply to drive price higher, why aren’t they buying?
The late day action moves higher on below average spread and decreasing volume. It shows ease of movement - the selling pressure that existed earlier in the day is no longer present, so price can move up on low volume. Alright, that’s not the worst thing for bulls; the market is still in an uptrend so it’s still fair to give the bulls the benefit of the doubt. But, it’s important to note that sellers had a definite effect on the market and buyers are not strong and are decreased from the last visit at this level.
The low demand rally fails at the underside of the former demand line, about half way back on the foregoing down wave. The 9 p.m. bar shows substantial effort versus result through the greatly reduced spread and increased volume with inability to progress to the upside. Buyers did win the bar, and price could travel higher if it was demand overcoming supply. However, in this case, the market pushes down on increasing spread and volume after showing no ability to go higher, confirming that sellers had absorbed buyers in that effort versus result bar.
After absolutely no ability to rally from support (no buyers left at this level), the market prints a bearish valid break. Supply is fully in control and the trend is down.
Summary:
Invalid break
Shortening of the thrust / loss of momentum
(after the SOT, I find very little in the way of bullish observations)
Presence of supply
Break of uptrend
Weak / low demand rally off new support
Lower high
Continued presence of supply which has become greater than demand
Valid bearish break


